What Are the Formal Requirements for a Thesis?
Once we've written our thesis, as a final step, let's start with the formal formatting.
In addition to the electronic version, it must also be submitted in printed form.
However, one "positive" effect of Covid was that at many universities, due to the introduced online education, students are no longer required everywhere to print and bind their thesis.
However, so we don't miss any case, we'll now assume that printing and binding must also be done.
First of all, let's clarify that we're now going through based on a specific university's requirements, but there may be differences at other universities, so check exactly what the expectations are at your school.
Let's Start with the Formal Structure:
- Title
- Table of Contents
- Introduction, Hypotheses
- Literature Review
- Development of Your Own Part: research materials and methods
- Research Results and Their Evaluation
- Conclusions, Recommendations
- Summary, Conclusion
- Bibliography
- Appendices, Supplements
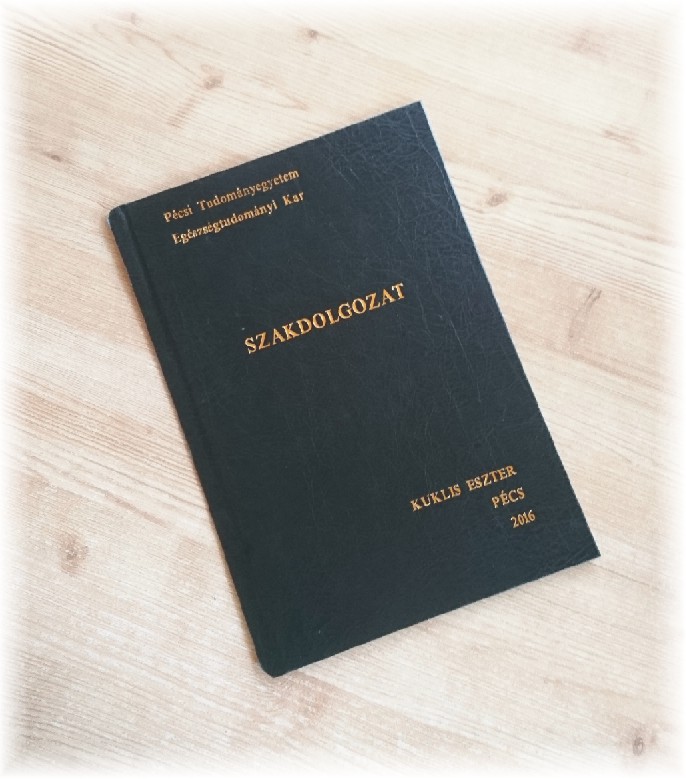
Outer Cover:

- Black colored, hardcover faux leather
- Size: 21.5 cm X 30.5 cm
- Inscription (in gold letters):
- center: THESIS
- top left corner: university name
- bottom right corner: author's (your) name, university city and year of completion
Inner Title Page Inscriptions:

- top left: The exact name of the educational institution (including location and major)
- center: your name, below it the title of the thesis
- bottom right corner: supervisor(s) name, below it title, below it workplace
Thesis Length:
The total length of the thesis can vary by degree type:
- bachelor's/BSc: approximately 40,000 - 80,000 characters, thus minimum 40 - 70 pages (±10%)
- master's/MSc: approximately 70,000 - 90,000 characters, 50-80 pages (±10%)
You can freely include figures and tables, however, note that they can only fill maximum 15% of the entire thesis length.
Printed Text Appearance:
- Times New Roman CE font
- 12 point font size
- one and a half (1.5 pt.) line spacing
- justified alignment
- margin settings:top-bottom: 2.5 cm right side: 2.5 cm left margin: 3 cm (due to binding, you need to add + 0.5 cm on the left side, that's why it's more than the others)
Page numbering: Arabic numerals, bottom, right side
Printing: A/4 office paper, SINGLE-sided printing
It's worth displaying (chapter) titles with line breaks, different font sizes to distinguish between chapters and subchapters.
Formal Requirements for Illustrative Materials:
You can enhance your thesis both content-wise and aesthetically with tables, figures, graphs, diagrams, photographs, etc.
But for this, every graph, table, figure, and others must be provided with a title and serial number.
It's worth noting that the size of inserted images, figures, diagrams, tables, etc. cannot exceed 50% of the page size.
When using a large number of tables, diagrams, etc., it's advisable to create a separate list of figures.
Now let's detail a bit what tricks you can use to spice up your thesis. ⬇️
1. Table Formatting
If you want numerical data to be more transparent, then organize them into tables.
Tables should be logical, transparent, and don't forget that they also need serial numbers and names, and at the bottom of the table, it's proper to indicate the source of the data.
If we're already inserting a table, it's worth compressing it into one page and not separating it.
Never leave out the unit of measurement, otherwise the typical math teacher comments will come "..and what is that? A sack of potatoes" 🙃
When formatting tables, pay attention to which formatting style best represents the nature of the data displayed in it.
Tables and figures should be in uniform format at the end.
2. Diagram and Graph Formatting
If you want to make the results of data processing, temporal changes, and relationships as spectacular as possible, then feel free to use diagrams and graphs.
When formatting, consider which diagram type (pie, column, bar, line chart), graph format fits best for displaying the data and relationships.
For data processing, applying statistical methods, and performing other increasingly complex calculations, for example, Excel or even SPSS can help.
Plus, with these programs, you can easily create diagrams and graphs too.
Let's not forget that our figures, tables, diagrams will be truly useful if we analyze and use the data in them, making references in the text.
3. Using Other Figures and Images
Thesis figures can be self-created technical drawings, sketches, flowcharts, drawings, photographs, maps, or diagrams.
For borrowed, photocopied figures, maps, only good quality copies and photographs are acceptable
Summary: Always keep in mind the specific, numerical formal requirements. Spice up the thesis with various figures, tables, and other details, but don't have too many, lest they think it's just a sneaky page count increase going on in the background 😉
 Pontbot